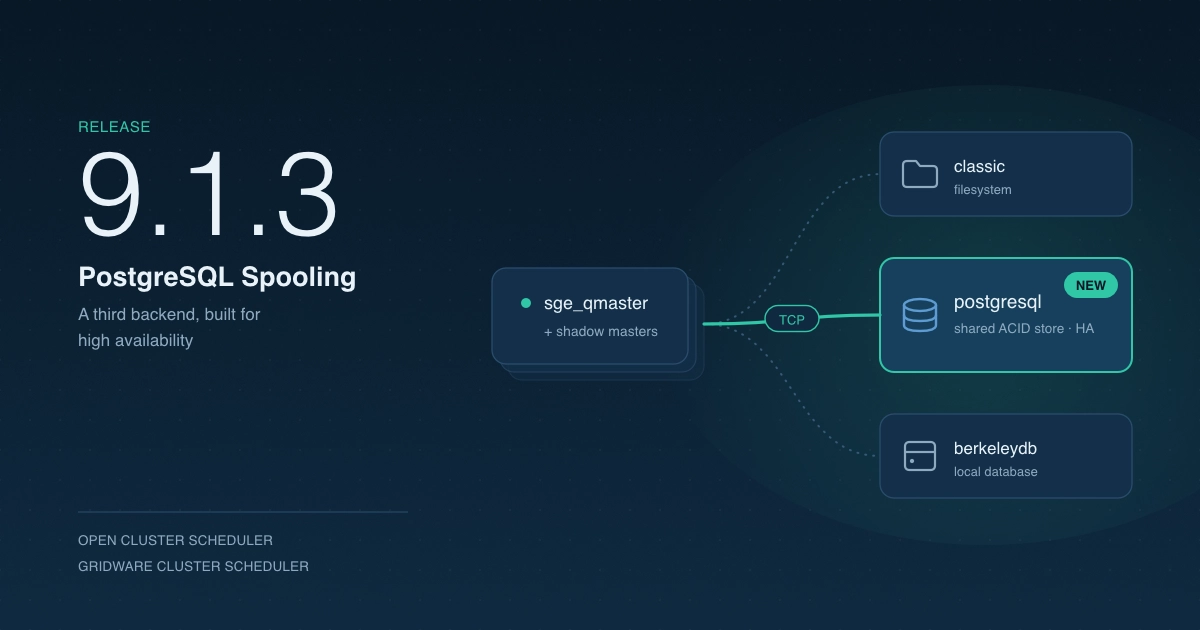
We’re pleased to announce the release of Gridware Cluster Scheduler (GCS) based on Open Cluster Scheduler (OCS) 9.1.1. Two headline additions in this release: a new SQL Integration that streams reporting data directly into a relational database for use with existing BI and dashboard tools, and a built-in MCP server in Qontrol that lets AI assistants safely inspect cluster state. The release also extends the License Manager to aggregate license features across multiple FlexLM servers, adds GPU device isolation with per-job accounting via qgpu, and ships an integrated share tree editor and tamper-evident operations log in Qontrol.
Release Highlights
- SQL Integration (formerly DBWriter / ARCo) — Reporting data flows directly into a relational database, with scheduled aggregation and per-scope retention.
- MCP Server in Qontrol — Built-in, read-only, off by default; lets AI assistants inspect cluster configuration, queues, hosts, and the share tree without ever modifying state.
- License Manager — Aggregates license features from multiple FlexLM servers into a single cluster resource, with cached totals during outages and feature aliasing.
- qgpu — GPU device isolation with automatic
CUDA_VISIBLE_DEVICEShandling and per-job DCGM accounting. - Qontrol — Integrated share tree editor, hash-chained operations log, and UI polish.
New SQL Integration (formerly DBWriter / ARCo)
GCS and OCS write detailed operational data to a reporting file: host load and consumable resources, queue consumables, job logging, job accounting, and share-tree usage. This data is valuable, but a flat file is rarely where you want it. You want it in your existing reporting solution alongside the rest of your infrastructure metrics and Grafana dashboards, in your data warehouse next to billing and chargeback data, or in whatever BI tool your team already uses.
dbwriter is the bridge. It reads the raw reporting file, persists it to a relational database, continuously computes derived metrics, and prunes data you no longer need — so every SQL-speaking tool you already own can access your cluster’s history.
What’s new
- Read, write, repeat.
dbwriteringests the reporting file and writes raw records into the reporting database. Run it once, or in continuous mode on an hourly cycle (or at whatever interval you configure). - Scheduled derived values. Configure aggregation rules per object — host, queue, project, department, user, or group — across hour, day, month, or year intervals. Derived values are computed at startup and on every cycle, so dashboards query pre-aggregated rows instead of recomputing averages from raw data on every panel load.
- Retention under your control. Per-scope deletion rules prevent unbounded database growth. Keep raw job records for 90 days, monthly derived values for seven years, or whatever your audit and capacity-planning policies require.
- One file describes everything. A single configuration file defines ingestion, aggregation, and retention.
Use cases
- Monitoring and dashboards. Connect Superset, Metabase, or Redash directly to the reporting database. Cluster load, queue wait times, share-tree fairness, and accounting become panels alongside your host and network metrics.
- Data warehouses and chargeback. Pull data into Snowflake, BigQuery, Redshift, or Postgres for cross-cluster reporting, per-project chargeback, and long-term capacity trends. Because derived values are precomputed, monthly finance reports run in seconds rather than minutes.
- Existing BI and reporting tools. Tableau, Power BI, Looker, and any other tool that speaks SQL can report on cluster usage without a custom parser for the raw reporting files.
- Alerting and anomaly detection. Build SQL-based alerts on derived metrics and feed them into your existing incident channels.
License Manager
The License Manager — the GCS component that connects to FlexLM license servers — can now aggregate license features from multiple FlexLM servers into a single cluster resource. The result: higher effective license utilization, simplified configuration, and continued job execution during transient license-server outages.
What’s new
- Multi-server feature pooling. Features from independent FlexLM servers are aggregated into a single cluster resource, so jobs see one accurate total instead of fragmented per-server views.
- Resilient collection. Per-server timeouts and a configurable grace period serve cached totals during short outages, allowing jobs to keep starting instead of queueing or aborting.
- Feature aliasing. Rename vendor feature codes to site-specific complex names without modifying existing user job scripts.
qgpu — GPU Device Isolation
GCS 9.1.1 introduces GPU device isolation. While GPU device isolation also works with Open Cluster Scheduler, qgpu adds further simplifications: it sets CUDA_VISIBLE_DEVICES (and NVIDIA_VISIBLE_DEVICES) correctly for jobs with or without GPU device isolation, and provides per-job GPU accounting through DCGM integration.
What’s new
- Safe co-location of jobs. Different jobs can run on the same compute node without accessing each other’s GPU devices, preventing unintended interruptions and failure cases.
- Automatic environment setup.
CUDA_VISIBLE_DEVICESandNVIDIA_VISIBLE_DEVICESare set correctly whether or not isolation is enabled. - Per-job GPU accounting. GPU consumption metrics are available in job accounting via
qacctthrough DCGM integration.
Qontrol
Qontrol — our web-based, REST-API-backed configuration UI for Gridware Cluster Scheduler — ships a major update in this release.
1. Built-in MCP server — read-only, secure by default
More than a year ago, when Anthropic introduced the Model Context Protocol, we published an open-source MCP server prototype for Open Cluster Scheduler and Gridware Cluster Scheduler.
Since then, we’ve spoken with dozens of administrators about how AI assistants fit into cluster operations. The recurring theme: we want this, but it has to be safe. We took what we learned and rebuilt the MCP server inside Qontrol — read-only, off by default, and hardened for production.
- Read-only by design. More than a dozen tools for inspecting cluster configuration, queues, execution hosts, parallel environments, the share tree, and the operations log. No write tools. An agent can see everything and change nothing.
- Safe deployment mode.
qontrol serve --mcp-port=9999embeds the MCP endpoint alongside the UI over HTTP. - Real authentication on the network path. HTTP mode requires a bearer token (API key or OAuth 2.1 JWT), reuses Qontrol’s existing API key manager, and uses the same TLS configuration as the web UI.
- Operational hardening. Configurable bind address (for example, loopback-only), graceful SSE shutdown, and partial-failure tolerance on expensive fetches.
Off by default; on when you’re ready. For local experimentation, qontrol mcp can also run standalone over stdio for use with Claude Desktop or Claude Code, with additional features including jobs and accounting.
2. Integrated share tree editor
The open-source standalone share tree editor we published last year is now a first-class part of Qontrol. You get a full view of the fair-share tree, plus local-first editing that you apply to the remote when ready: add, rename, modify, or delete individual nodes, or operate on whole subtrees atomically. Every remote mutation is captured in the operations log with before/after state.
3. Operations log
Every mutating action that flows through Qontrol — create, update, or delete, on any resource — is recorded as a structured JSONL entry:
- Who, when, what. User and authentication method, timestamp, resource type and ID, and the full before/after bodies.
- Hash-chained entries. An auditor can verify that the log has not been tampered with.
- ECS-aligned field names (Elastic Common Schema). FluentBit, Loki, Datadog, Splunk, and similar aggregators parse the log without custom rules.
Off by default; opt in via --operations-log <path> or --operations-log-stdout.
4. UI polish
The Qontrol user interface has been refined and wording improved for better usability.
Availability
Gridware Cluster Scheduler and Open Cluster Scheduler 9.1.1 are available now. See the documentation and release notes for upgrade instructions and the full list of changes.